I've been using Visual Studio Code as my daily driver for a few years already.
Today I'm gonna share with you how to debug your PHP code using XDebug 3's "Step Debugger" feature (the breakpoints).
Installing xdebug
I'm on a Debian 11 server (and Desktop, but that applies to Windows as well).
So I first need to install php-xdebug package:
sudo apt install php-xdebug
Configuring xdebug
I then need to configure my PHP configuration so it has the proper settings.
In /etc/php/8.1/fpm/php.ini, I add the following lines, under the [xdebug]
section:
[xdebug]
xdebug.mode=debug
xdebug.start_with_request = yes
xdebug.client_host=<SERVER_IP>
xdebug.client_port=9003
You need to set your server's public IP for the xdebug.client_host setting.
Next, you'll need to run this for your changes to take effect:
sudo systemctl restart php8.1-fpm.service
Configuring VS Code
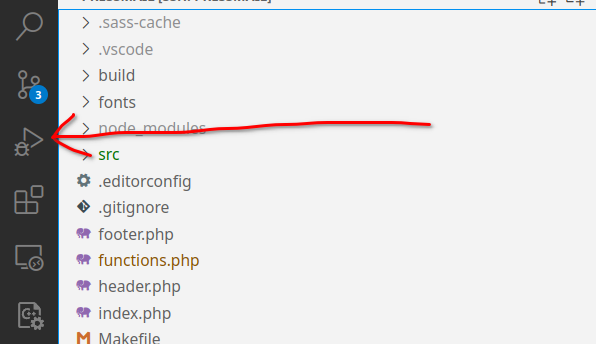
Go to the "Run and Debug" section in the left-hand panel.

Click the "Add Configuration..." button.
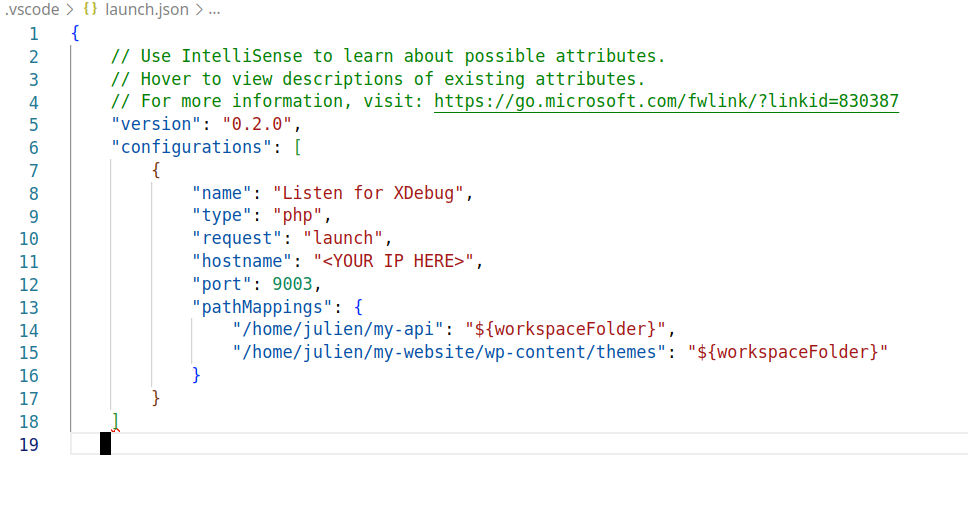
It will generate a launch.json file that look like the following:

You can remove pretty much everything but the first entry in the
configurations array and replace it with the following:
"name": "Listen for XDebug",
"type": "php",
"request": "launch",
"hostname": "<YOUR IP HERE>",
"port": 9003,
"pathMappings": {
    "/home/julien/my-api": "${workspaceFolder}",
    "/home/julien/my-website/wp-content/themes": "${workspaceFolder}"
}
Make sure to replace <YOUR IP HERE> with your actual server's IP.
Testing it
Now, you should be able to open a PHP file in VS Code and set a breakpoint. Then go to your website's URL that triggers the code you're debugging.
